WHAT DOES THE DATA SAY?
The data collection undertaken for this report combines a review of academic literature and two surveys undertaken among members and partners of WFDB and Sense International, as well as case studies. Additionally, a quantitative analysis of census and other large survey data was undertaken, representing the largest and most internationally representative analysis of the situation of deafblindness conducted to date.
The majority of the available literature came from the United States and European countries, and almost no studies were identified from low and middle-income nations. As such, a specific focus has been placed on quantitative data analysis and fact-finding from the global South.
At the 2018 Helen Keller World Conference, the findings from this research were presented to WFDB members. Women and men with deafblindness enriched this information with their personal experiences and elaborated on the recommendations.
METHODOLOGY
REVIEW OF LITERATURE
PubMed, Google Scholar, Web of Science and Education Resources Information Centre (ERIC) were searched between August and November 2017. Search terms included ‘deafblindness’, ‘dual sensory impairment’ and combinations of ‘deaf’ and ‘blind’, ‘visual impairment’ and ‘hearing impairment’. References made to relevant articles were also checked to obtain additional sources.
Studies were included in the review if they were written in English or French, focused on measurements of deafblindness (definitions, estimates of prevalence and causes), or the impact of deafblindness. There were no restrictions by study location or setting.
COUNTRY DATA ANALYSES
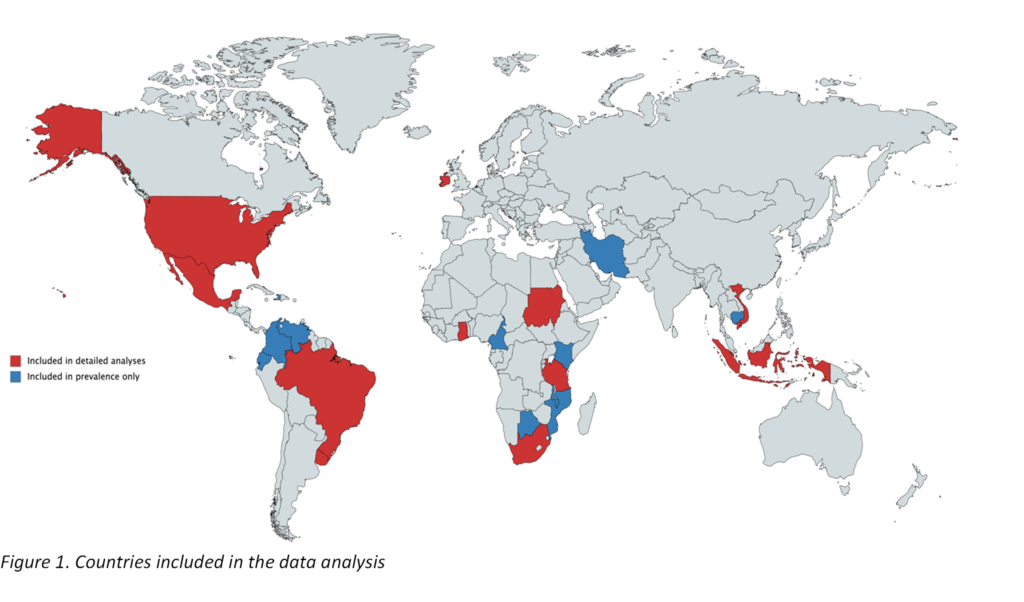
Nationally representative population-based surveys from 22 countries were used to measure the prevalence of deafblindness (see Figure 1). Eleven of these countries were selected for further detailed analysis based on their relevance, particularly in relation to how they measured deafblindness and whether they provided a large enough sample size to complete an analysis. Consideration was given to ensuring representation by region and country income group. In total, over 97.6 million people were included across the 22 datasets. This is the largest population-based analysis on deafblindness conducted to date and includes evidence from a variety of regions and country income groups.
Statistical Appendix 1 provides an in-depth look at the data analysis methods employed, including an explanation of key statistical terms, such as ‘95% confidence’ and ‘odds ratios’.
WFDB AND SENSE INTERNATIONAL MEMBER AND PARTNER SURVEYS
To fully identify the issues and remove the barriers experienced by persons with deafblindness, it is essential to harness the perspectives of support organisations. A survey was conducted among all member organisations of the WFDB. The WFDB survey was distributed to 76 associations of persons with deafblindness with a response rate of 56% (43 answers). The same approach was used to undertake a survey among professionals working with or for persons with deafblindness on a global scale. Sense International and WFDB disseminated the questionnaire to Sense International country programmes, International Disability and Development Consortium (IDDC) members and DbI (Deafblind International) members. A total of 20 questionnaires were returned. In combination, the two surveys allowed the collection and collation of information from organisations of persons with deafblindness and their allies from 50 countries, as follows:
- High-income countries: Australia, Chile, Canada, Sweden, Spain, Switzerland, Japan, Macau (China), Austria, Belgium, USA, Uruguay, Hungary, Italy, Czech Republic, Norway, Denmark, and Germany.
- Upper middle-income countries: South Africa, Malaysia, Dominican Republic, Romania, Croatia, Russia, Peru, Brazil, Colombia, Ecuador, Mexico, Venezuela, and Thailand.
- Lower middle-income and low-income countries: India, Ghana, Bangladesh, Guatemala, Salvador, Kenya, Uganda, Tanzania, Ethiopia, Malawi, Nepal, Philippines, Bolivia, Honduras, Nicaragua, Ivory Coast, Nigeria, and Zambia.
THE CHALLENGES OF ‘COUNTING’ PERSONS WITH DEAFBLINDNESS
The literature reviewed provided contrasting definitions and measurements of deafblindness, with no agreement on ‘best practice’ [7, 10, 11]. In broad terms, definitions of deafblindness fell into two major categories [10]: definitions (clinical assessments of the level of hearing and visual impairment); or functioning-based definitions (self-report or observations of a person’s ability to hear and see, and its impact on the individual’s participation in everyday activities). Even within these categories, significant variations in criteria were used to determine deafblindness. For example, different thresholds of hearing and visual loss in clinical assessments were identified across the studies. The lack of a clear, consistently used definition of deafblindness makes it difficult to gather data that is comparable between studies, settings and over time [7, 9-11]. However, across the range of definitions, some commonalities were identified. For example, almost all definitions acknowledged that deafblindness does not only refer to people who are both deaf and blind, but include people with some vision and/or hearing [12]. A key characteristic of deafblindness is the combined effect of hearing and vision loss on a person’s ability to communicate, so that the severity of each impairment is such that one sense cannot compensate for the other [10, 12].
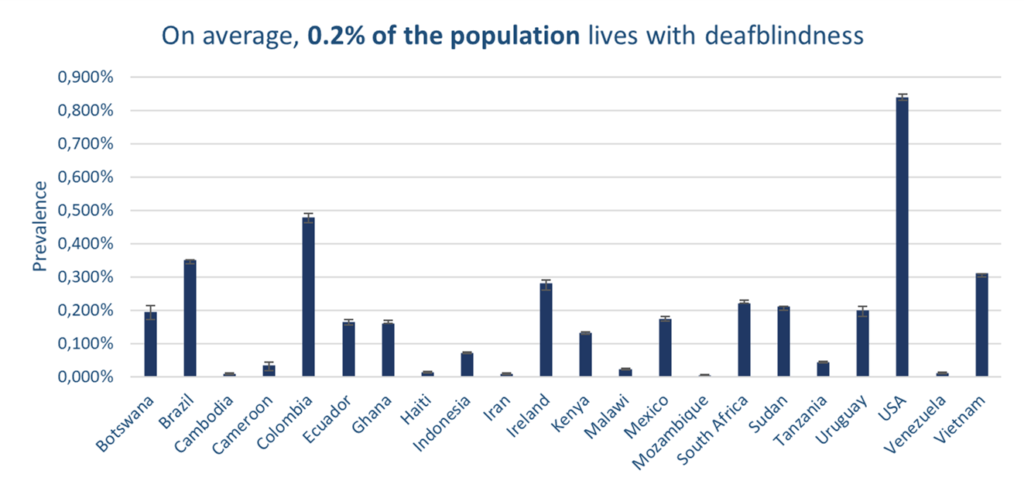
No large, population-based studies were identified that measured the all-age prevalence of deafblindness. The analysis of country-level census data, therefore, provides a unique opportunity to estimate the prevalence of deafblindness across a range of contexts. Figure 2 shows the prevalence of deafblindness in each of the 22 country datasets initially explored. The measurement of deafblindness varied across the datasets. For example, in Iran, Indonesia, Ecuador, Venezuela and Haiti, definitions included people who are completely deaf and blind, while the remaining countries also included people with some residual vision and hearing. A sub-set of censuses used the Washington Group Questions, which is an internationally comparable module on reported difficulties with six functional domains, including vision and hearing. Extended analyses are focused on the sub-set of censuses.
The prevalence of severe deafblindness (in individuals aged five years and older) across the 22 surveys ranged between 0.01% in Cambodia, Haiti, Iran and Venezuela, to 0.85% in the United States. The weighted prevalence across all datasets was 0.21%.
In datasets that used the Washington Group Questions, it was possible to explore the prevalence and different levels of deafblindness. Figure 3 illustrates the prevalence of deafblindness using a lower threshold, whereby ‘some’ or a ‘greater difficulty’ in seeing and hearing was reported. The prevalence of this ‘less severe’ level of deafblindness is much higher than severe deafblindness, and ranges from between 0.4% in Tanzania and 3.1% in Brazil.
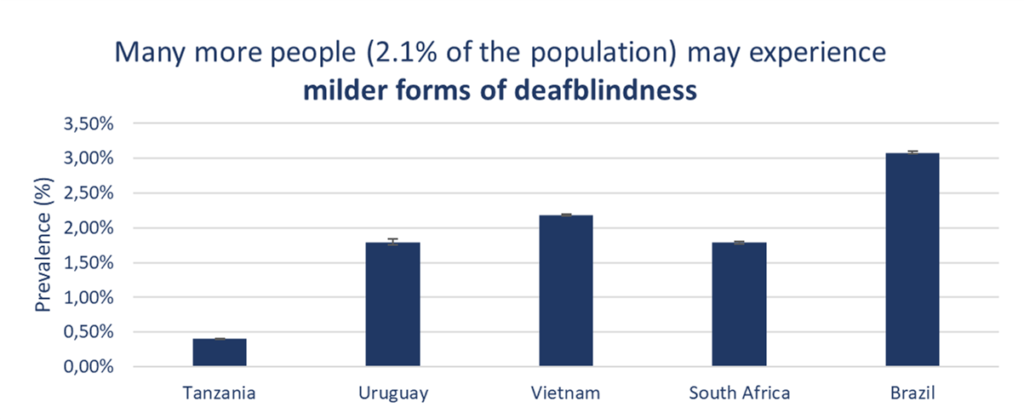
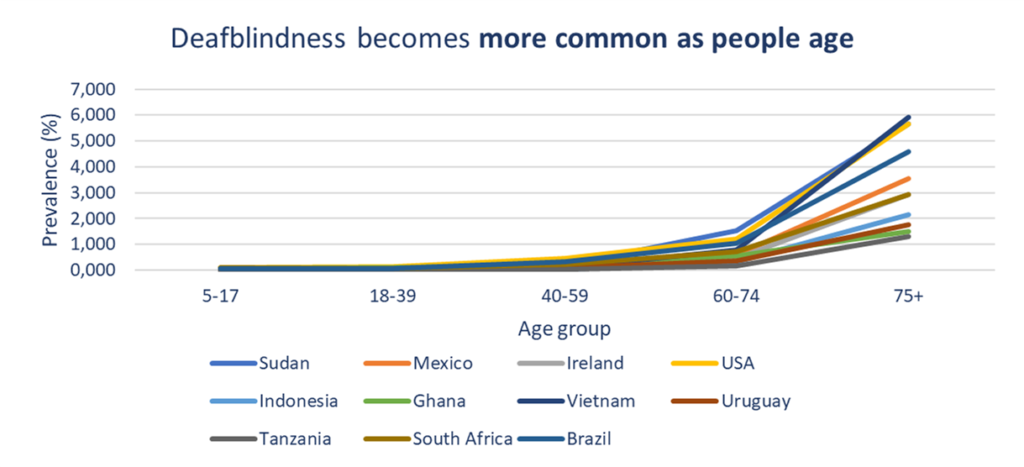
Figure 4 details the prevalence of deafblindness in the 11 countries chosen for subsequent analyses throughout the report, stratified by age group. The graph illustrates a strong association between the prevalence of deafblindness and age. In almost all study countries, less than 0.1% of the population aged 40 years and under has deafblindness, and this rises to 6% of the population aged 75 and over.
An increased prevalence of deafblindness linked to age is also reflected in the literature review [11, 13-18]. For example, a large, general population study of sensory impairments in adults aged 50 years and older in 11 European countries identified a prevalence of 5.9% [18]. While deafblindness is more common among older age groups, deafblindness among children and young adults presents additional implications, for example in terms of education and employment.
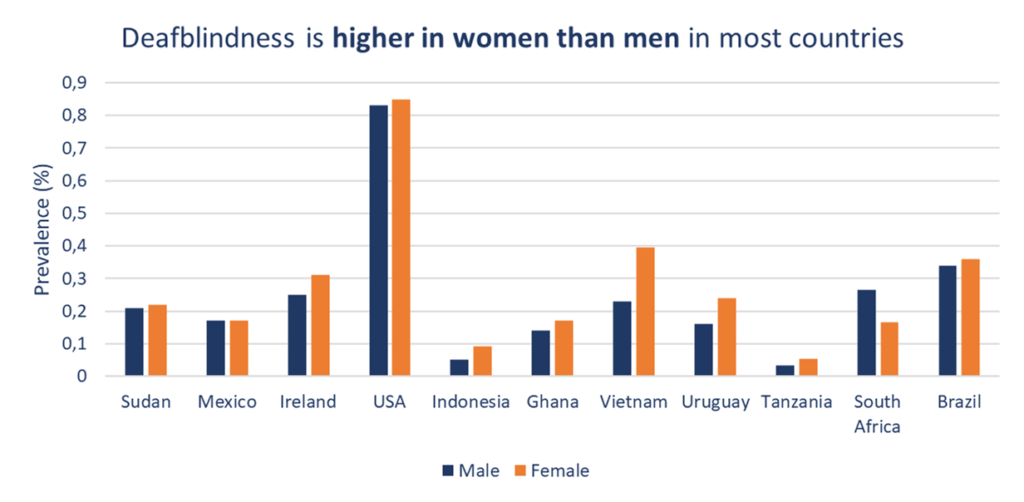
The prevalence of deafblindness was also found to be slightly higher in women than men in each of the study countries (Figure 5). After accounting for age (given that women generally live longer than men), this finding was statistically significant in all datasets, except Ireland and Uruguay.
RECOMMENDATIONS
- Adopt, in consultation with persons with deafblindness and their organisations, a consistent definition and measurement of deafblindness, and collect, disaggregate and analyse data, to assess and monitor situation of persons with deafblindness, including through relevant analyses of national datasets using the Washington Group Short Set questions or other methods.
- Conduct additional research on the issues facing persons with deafblindness, including health status and access to healthcare, social participation and wellbeing, quality of work and education, causes, and age of onset. Undertake impact evaluations of interventions designed to improve inclusion.

